Continuing from my previous post, I now focus on detailed match statistics, rather than the available aggregate data. By scraping very detailed data from each match of the 2018/2019 Norwegian hockey season, my goal is to present aggregate data that are not available at the source webpage. The data material is scraped from Hockey live.
The code
I started by simply downloading the main HTML file manually from the web browser. This main page cointains URL links to all 216 matches of the regular season. Scraping the HTML table is straightforward, but this gives you the URL text, not the actual URL link. I found this tip, saying that an easy fix is to edit rvest’s html_table-function, using the trace-function in R:
library(rvest)
match_dat = read_html("GET_18_19.html",encoding ="UTF-8")

matchList=match_dat%>%html_nodes("table")%>%.[[3]]%>%html_table()

trace(rvest:::html_table.xml_node, quote({
  values      <- lapply(lapply(cells, html_node, "a"), html_attr, name = "href")
  values[[1]] <- html_text(cells[[1]])
}), at = 14)

tmp=match_dat%>%html_nodes("table")%>%.[[3]]%>%html_table()
untrace(rvest:::html_table.xml_node)

matchList$Results=tmp$Results
The next step is simply to iterate over the URL links, adding the scraped data of each URL to a list. The actual scraping in each iteration is similar to what is done in my previous post. Below are the resulting aggregate data produced by iterating this list of match statistics.
The results
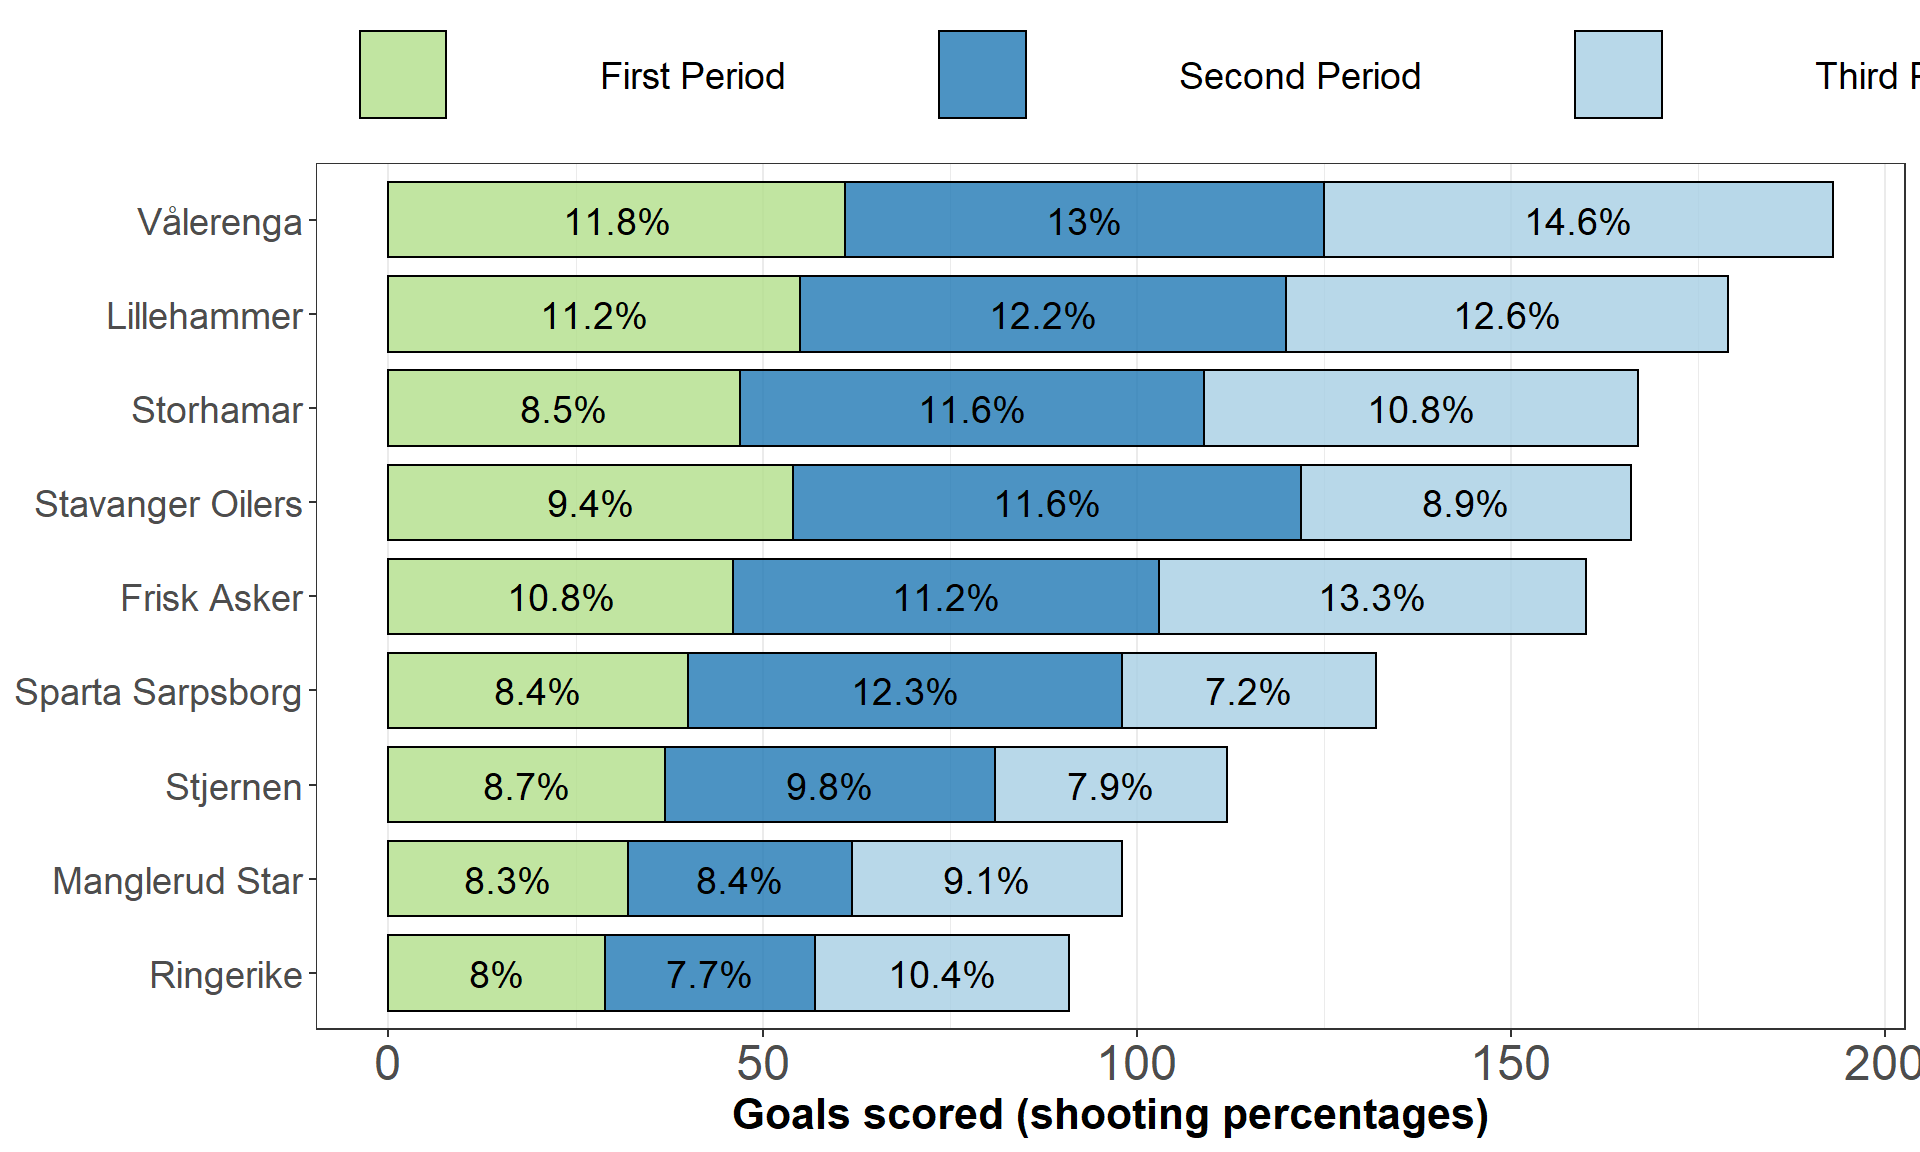
Goalscoring
The figure shows total goals per team, for each of the three periods. Shooting percentages are also displayed (the percentage of shots on goal that results in a goal).
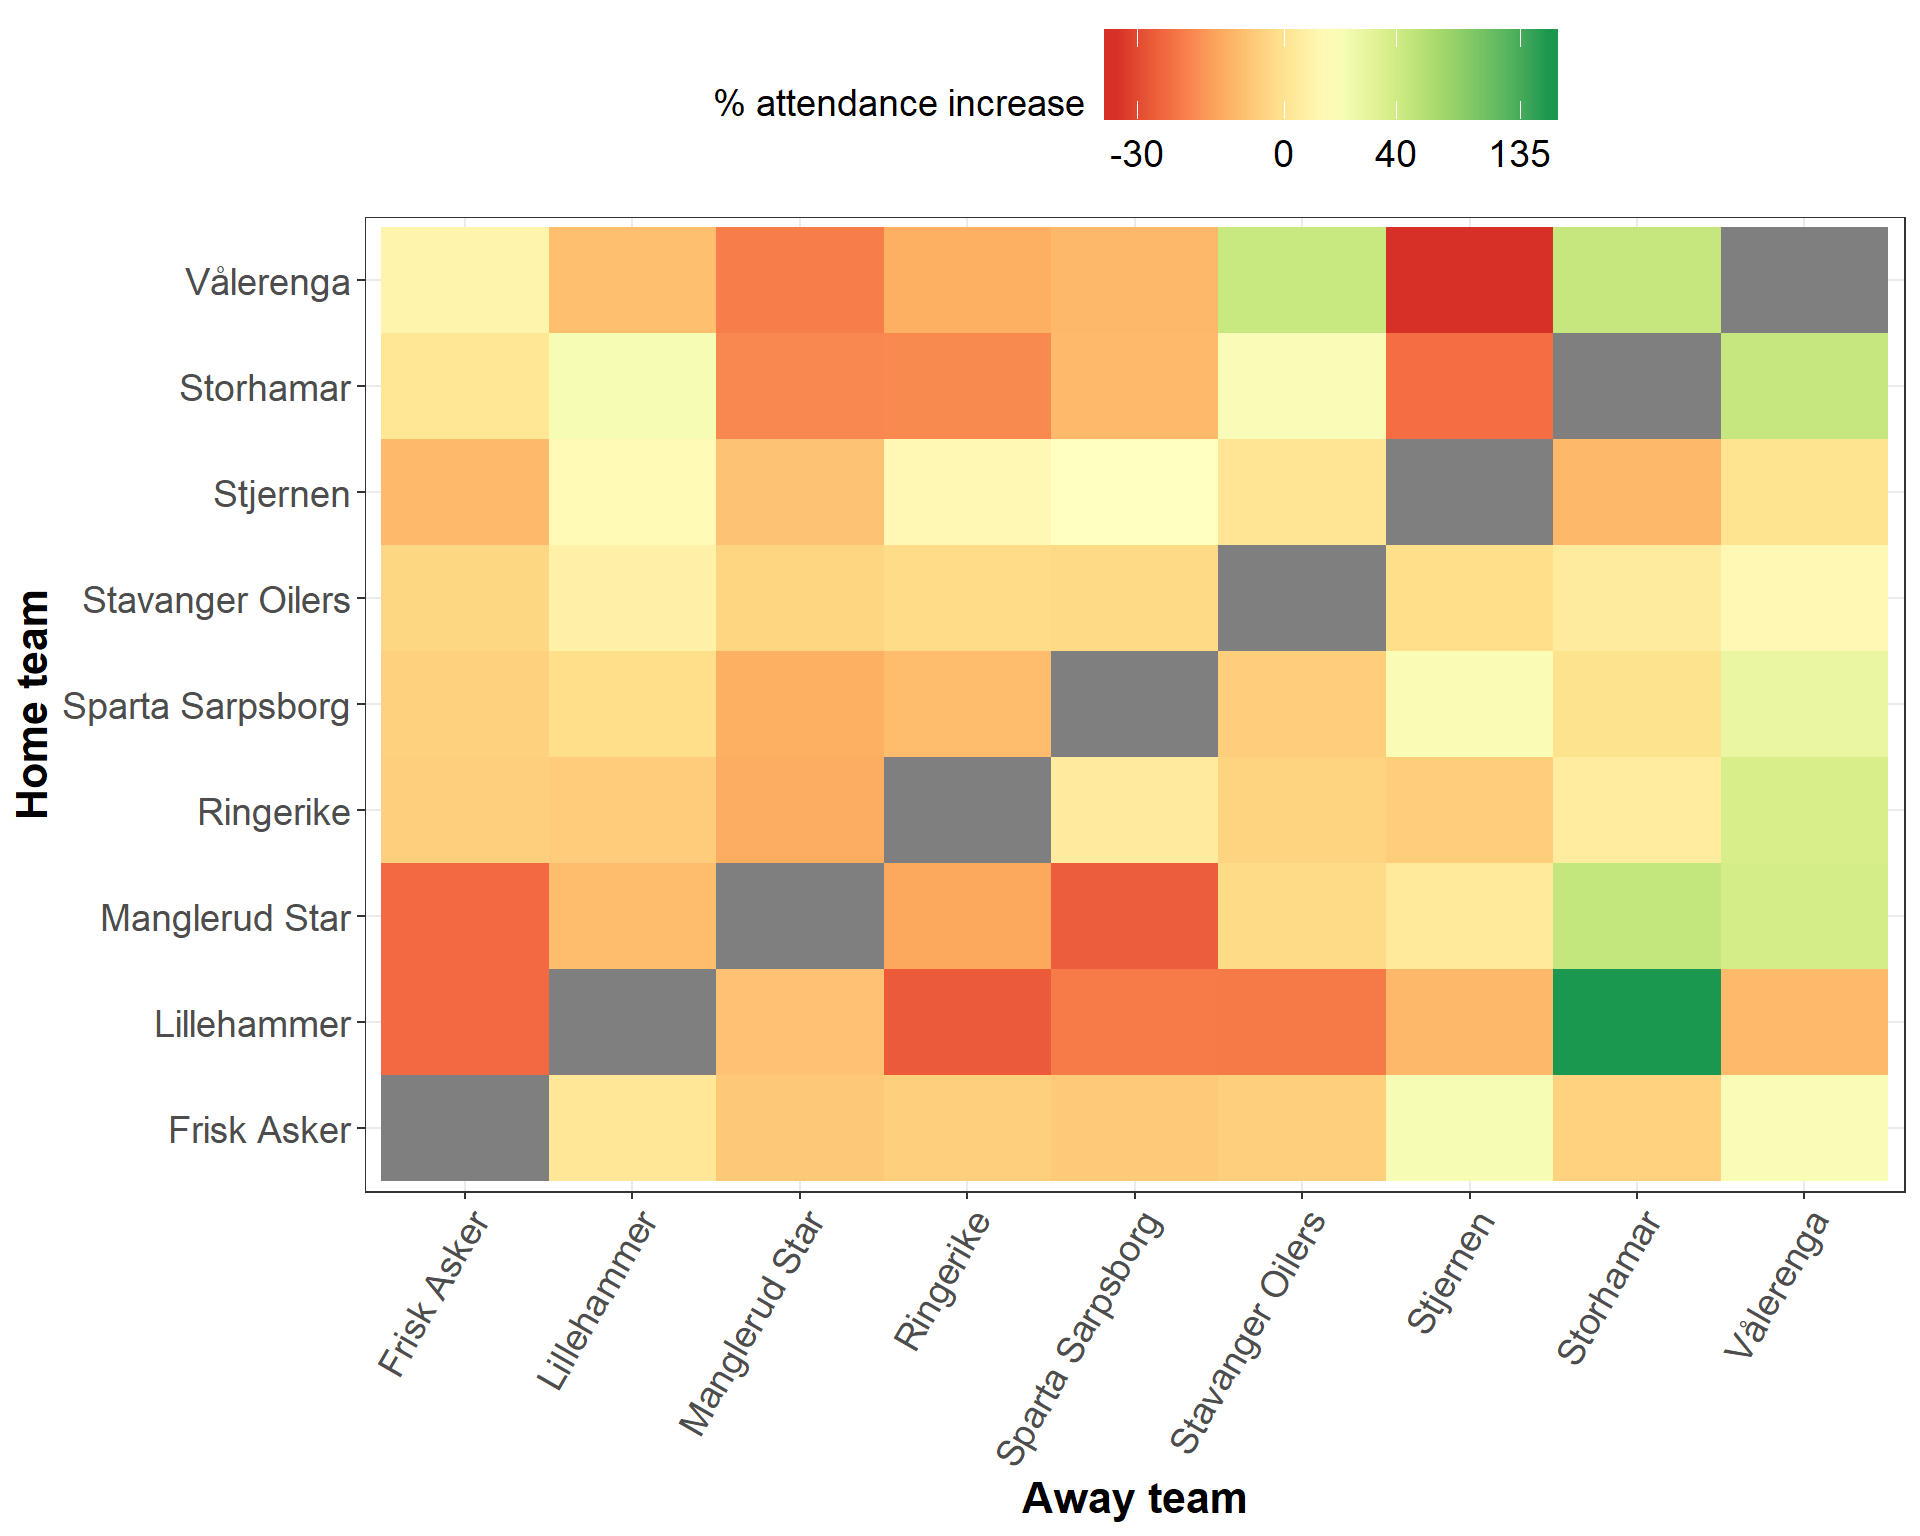
Attendance
Here we see how attendance depends on which team is visiting, shown as percentage increase. The baseline is the average attendance at the home teams’ stadium this season.
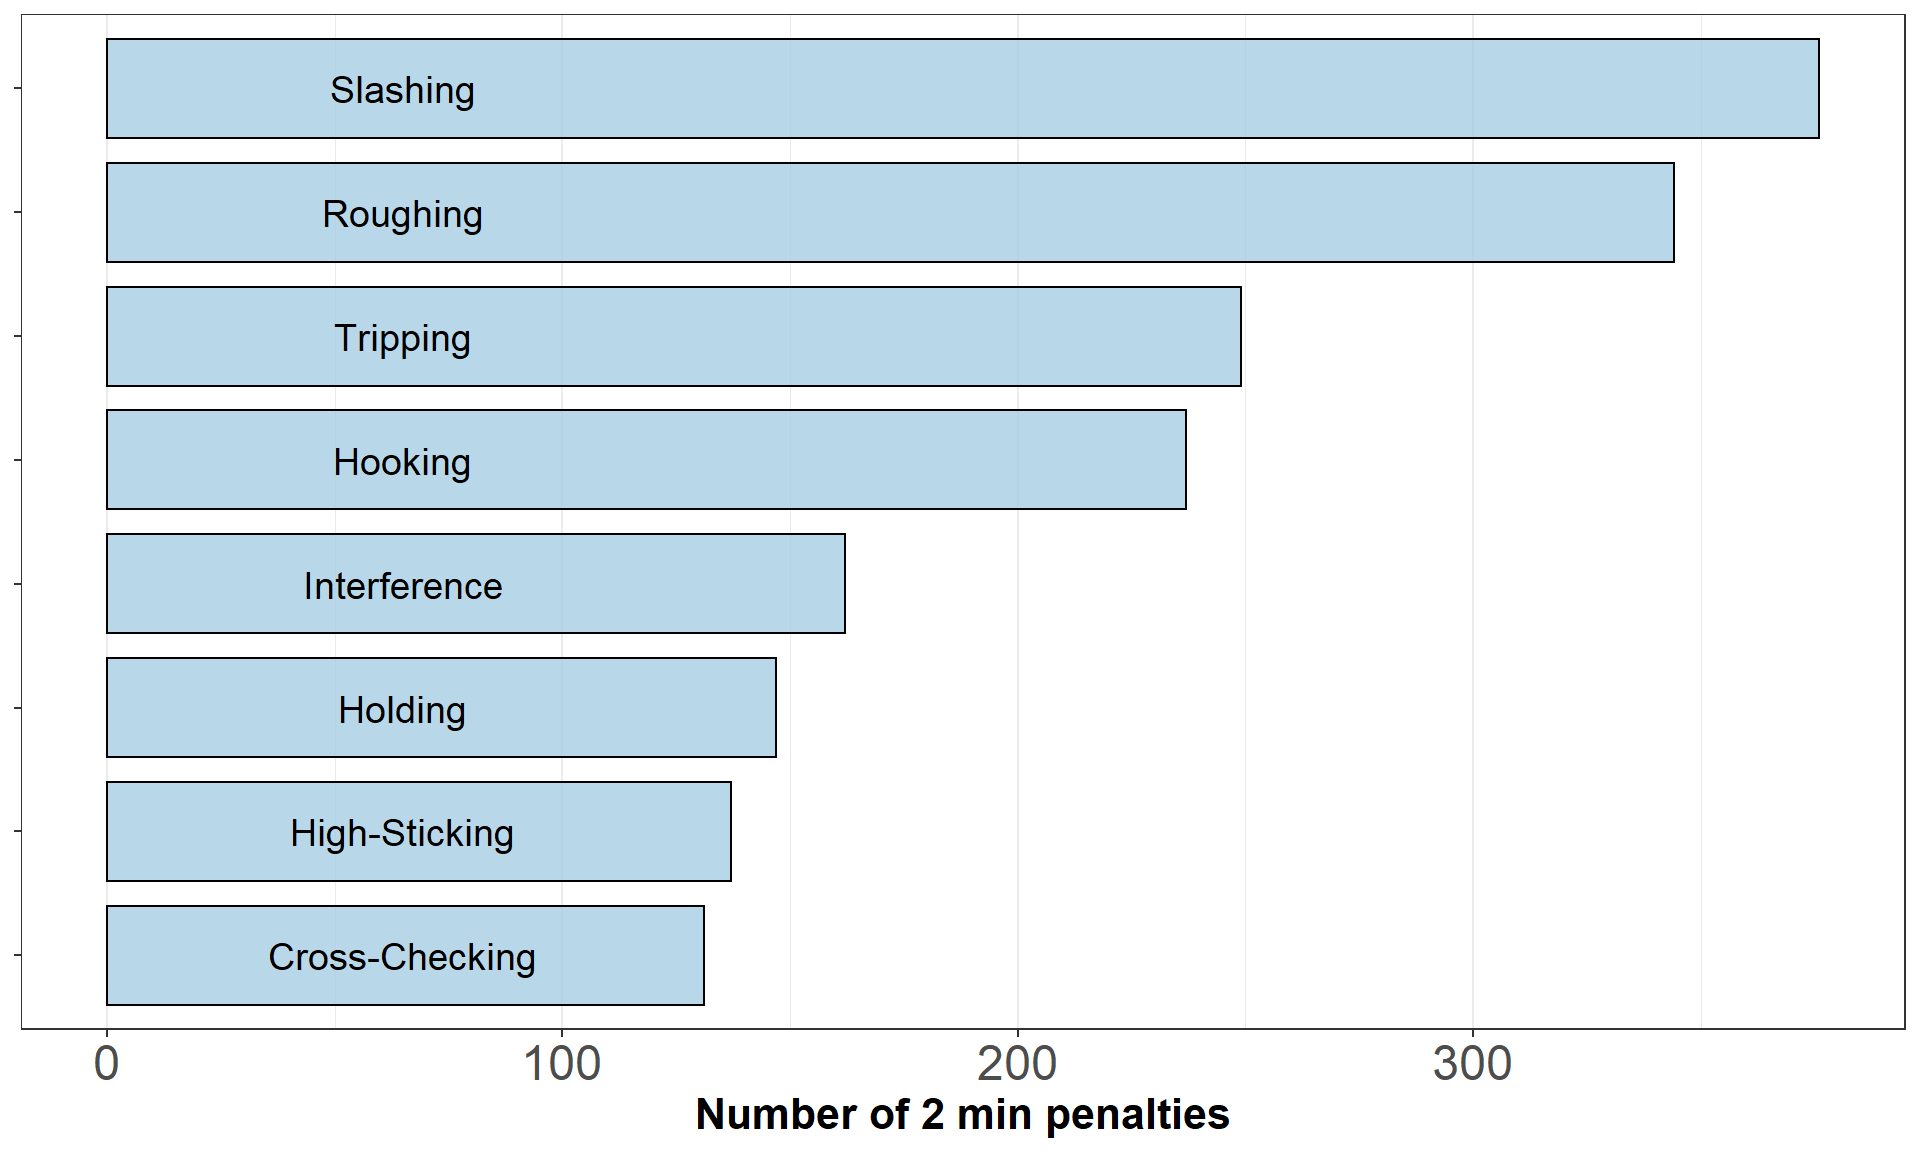
Penalty types
The figure shows the total count of each penalty type, for all teams.
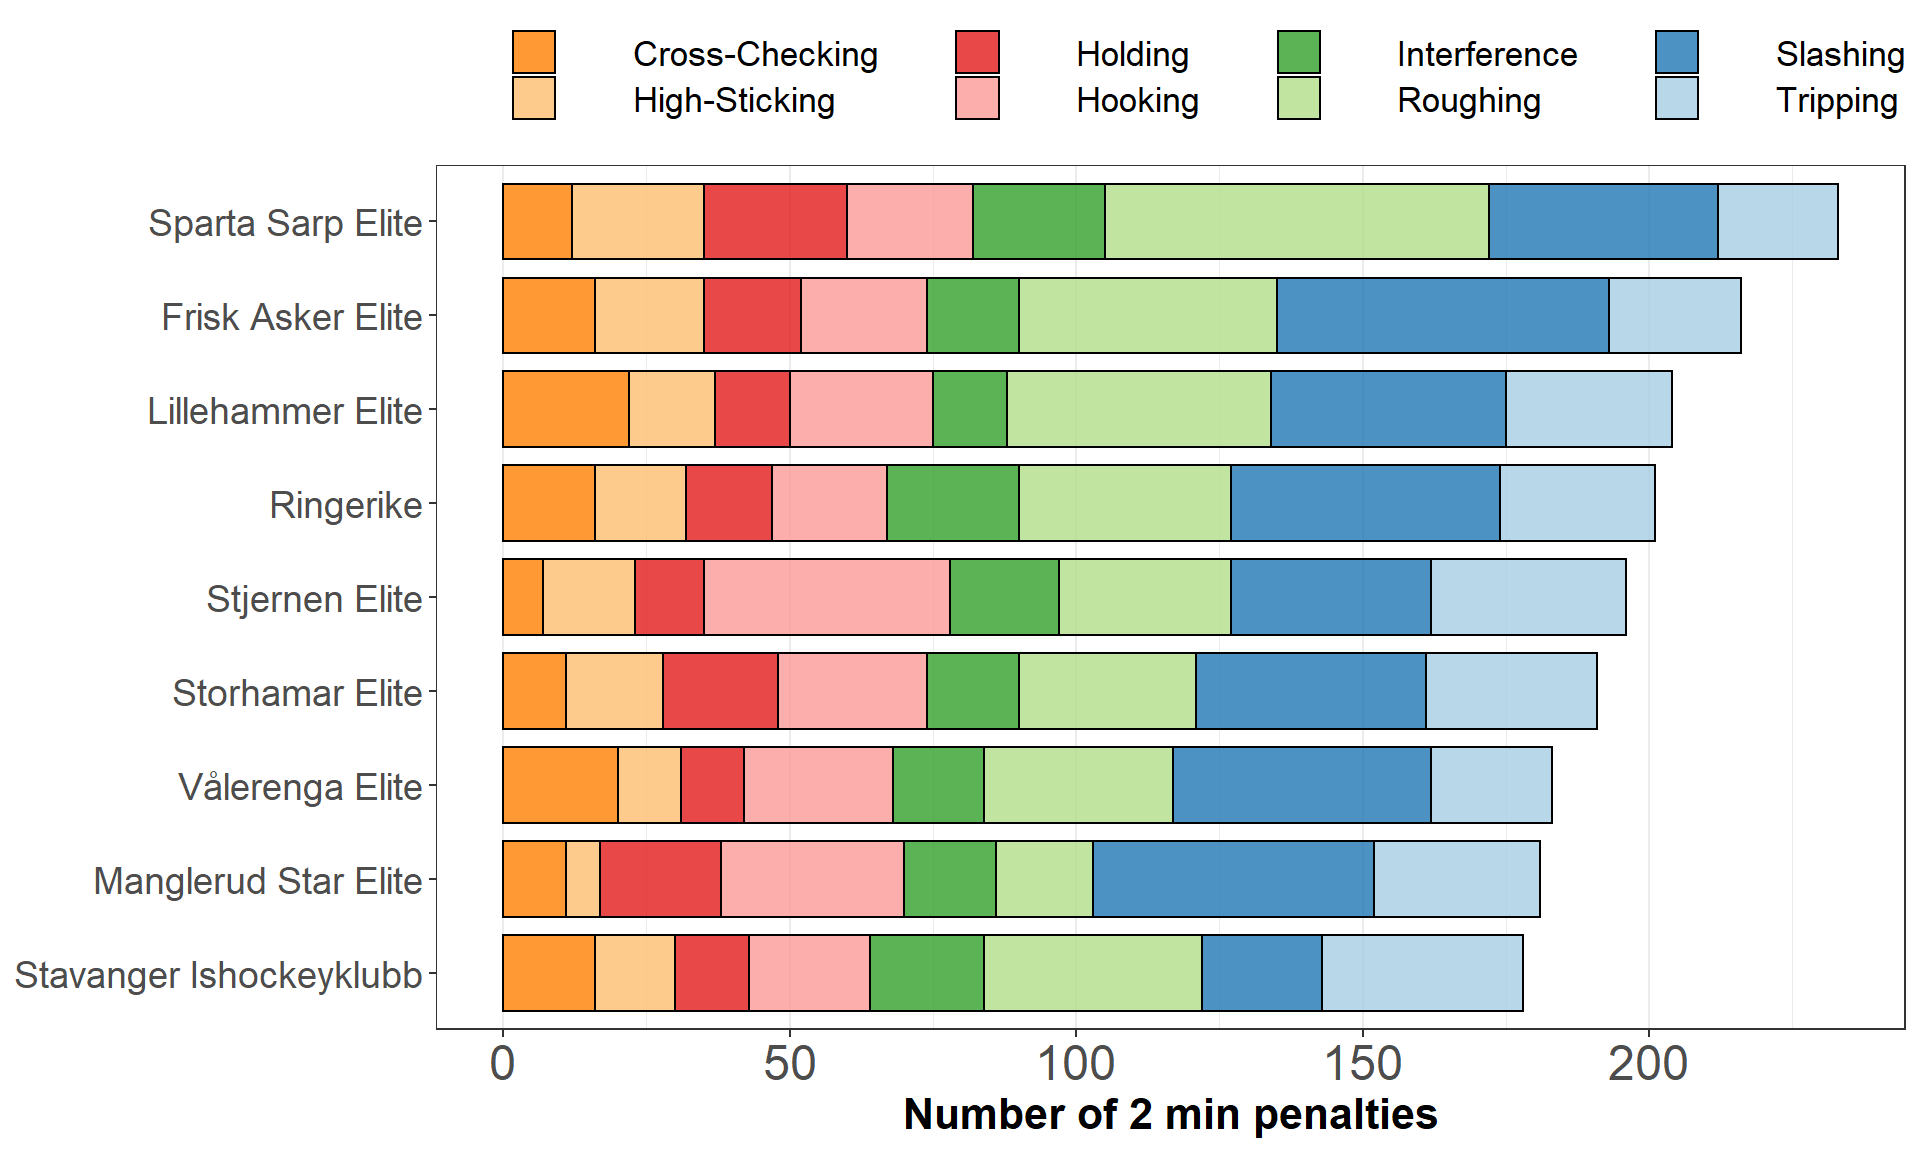
Penalty types per team
The figure shows the total count of each penalty type, per team.
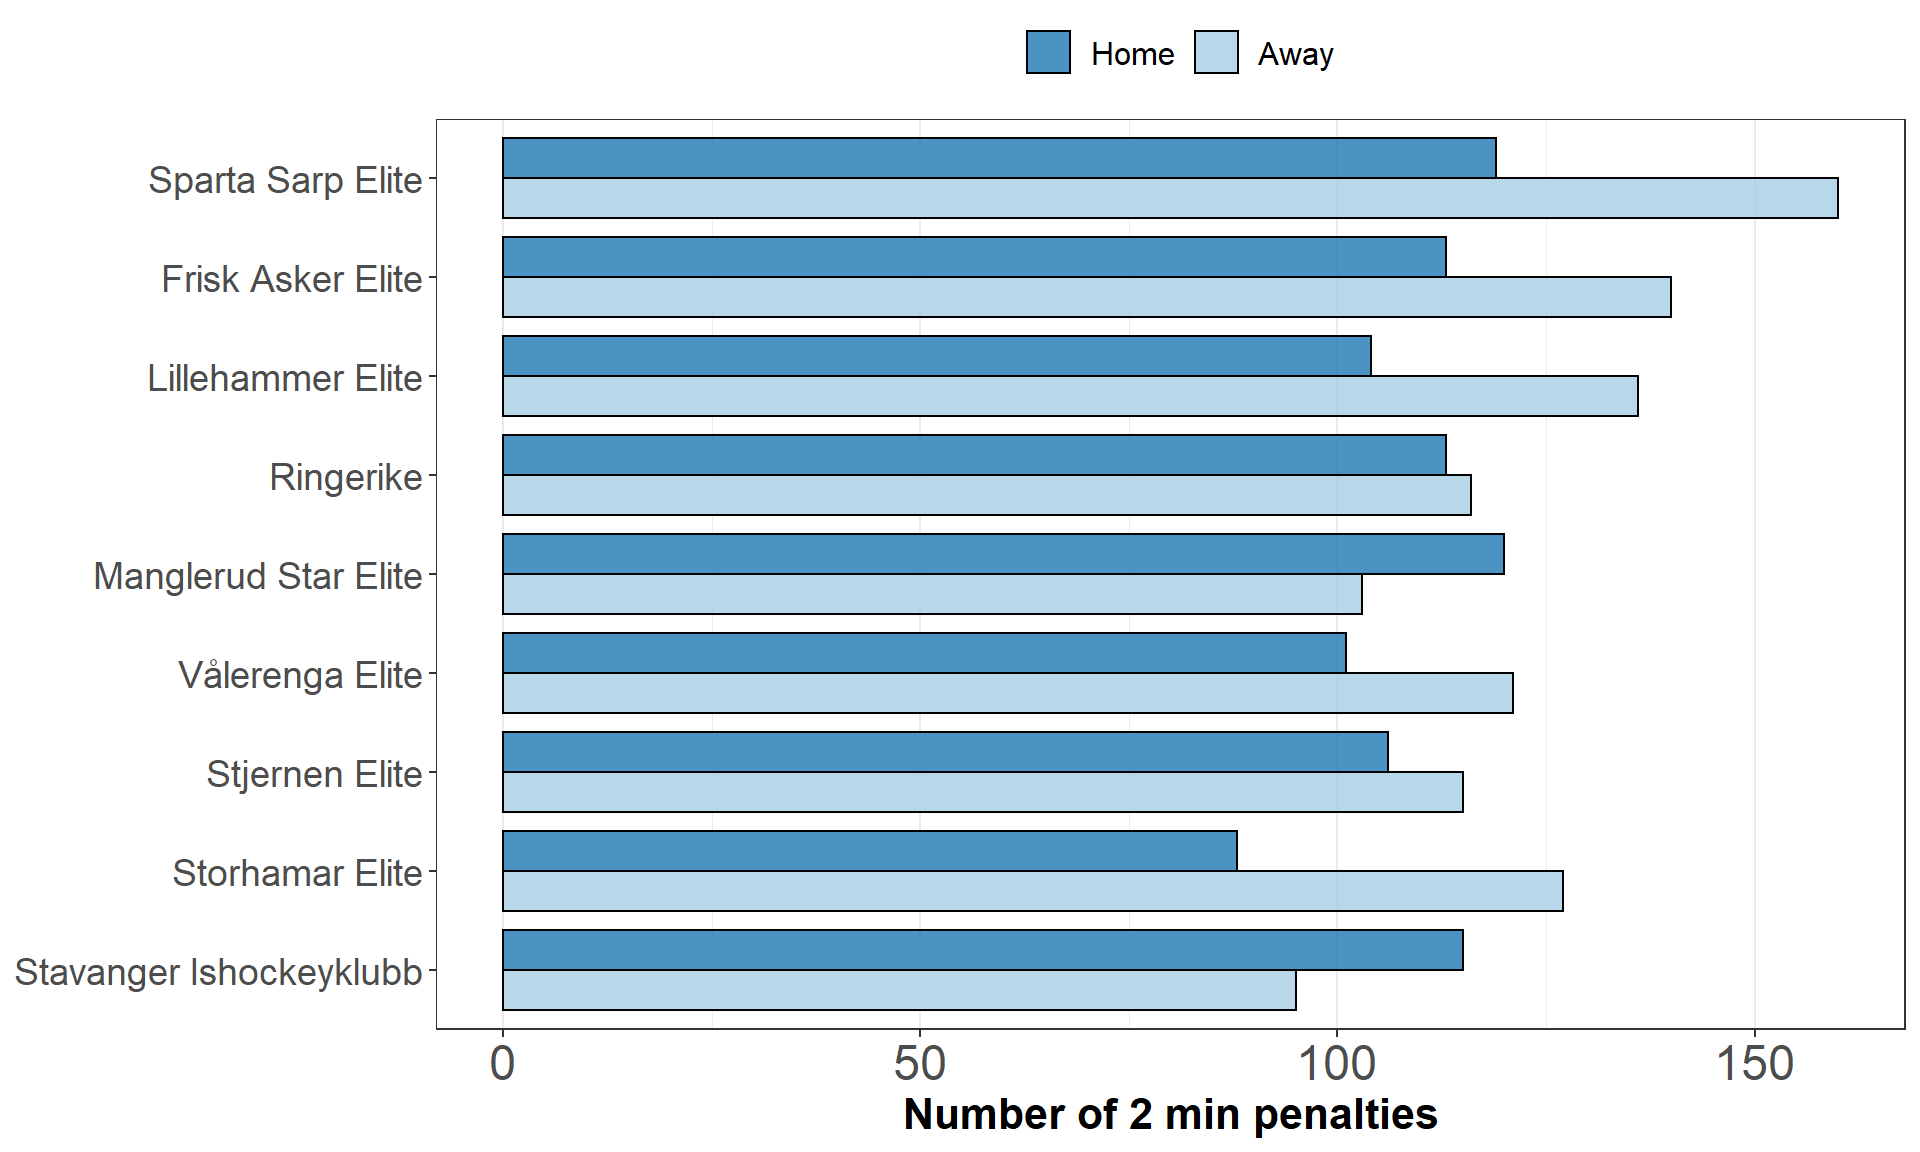
Home advantage?
The figure shows the total count of penalties on home ice and away ice, per team.
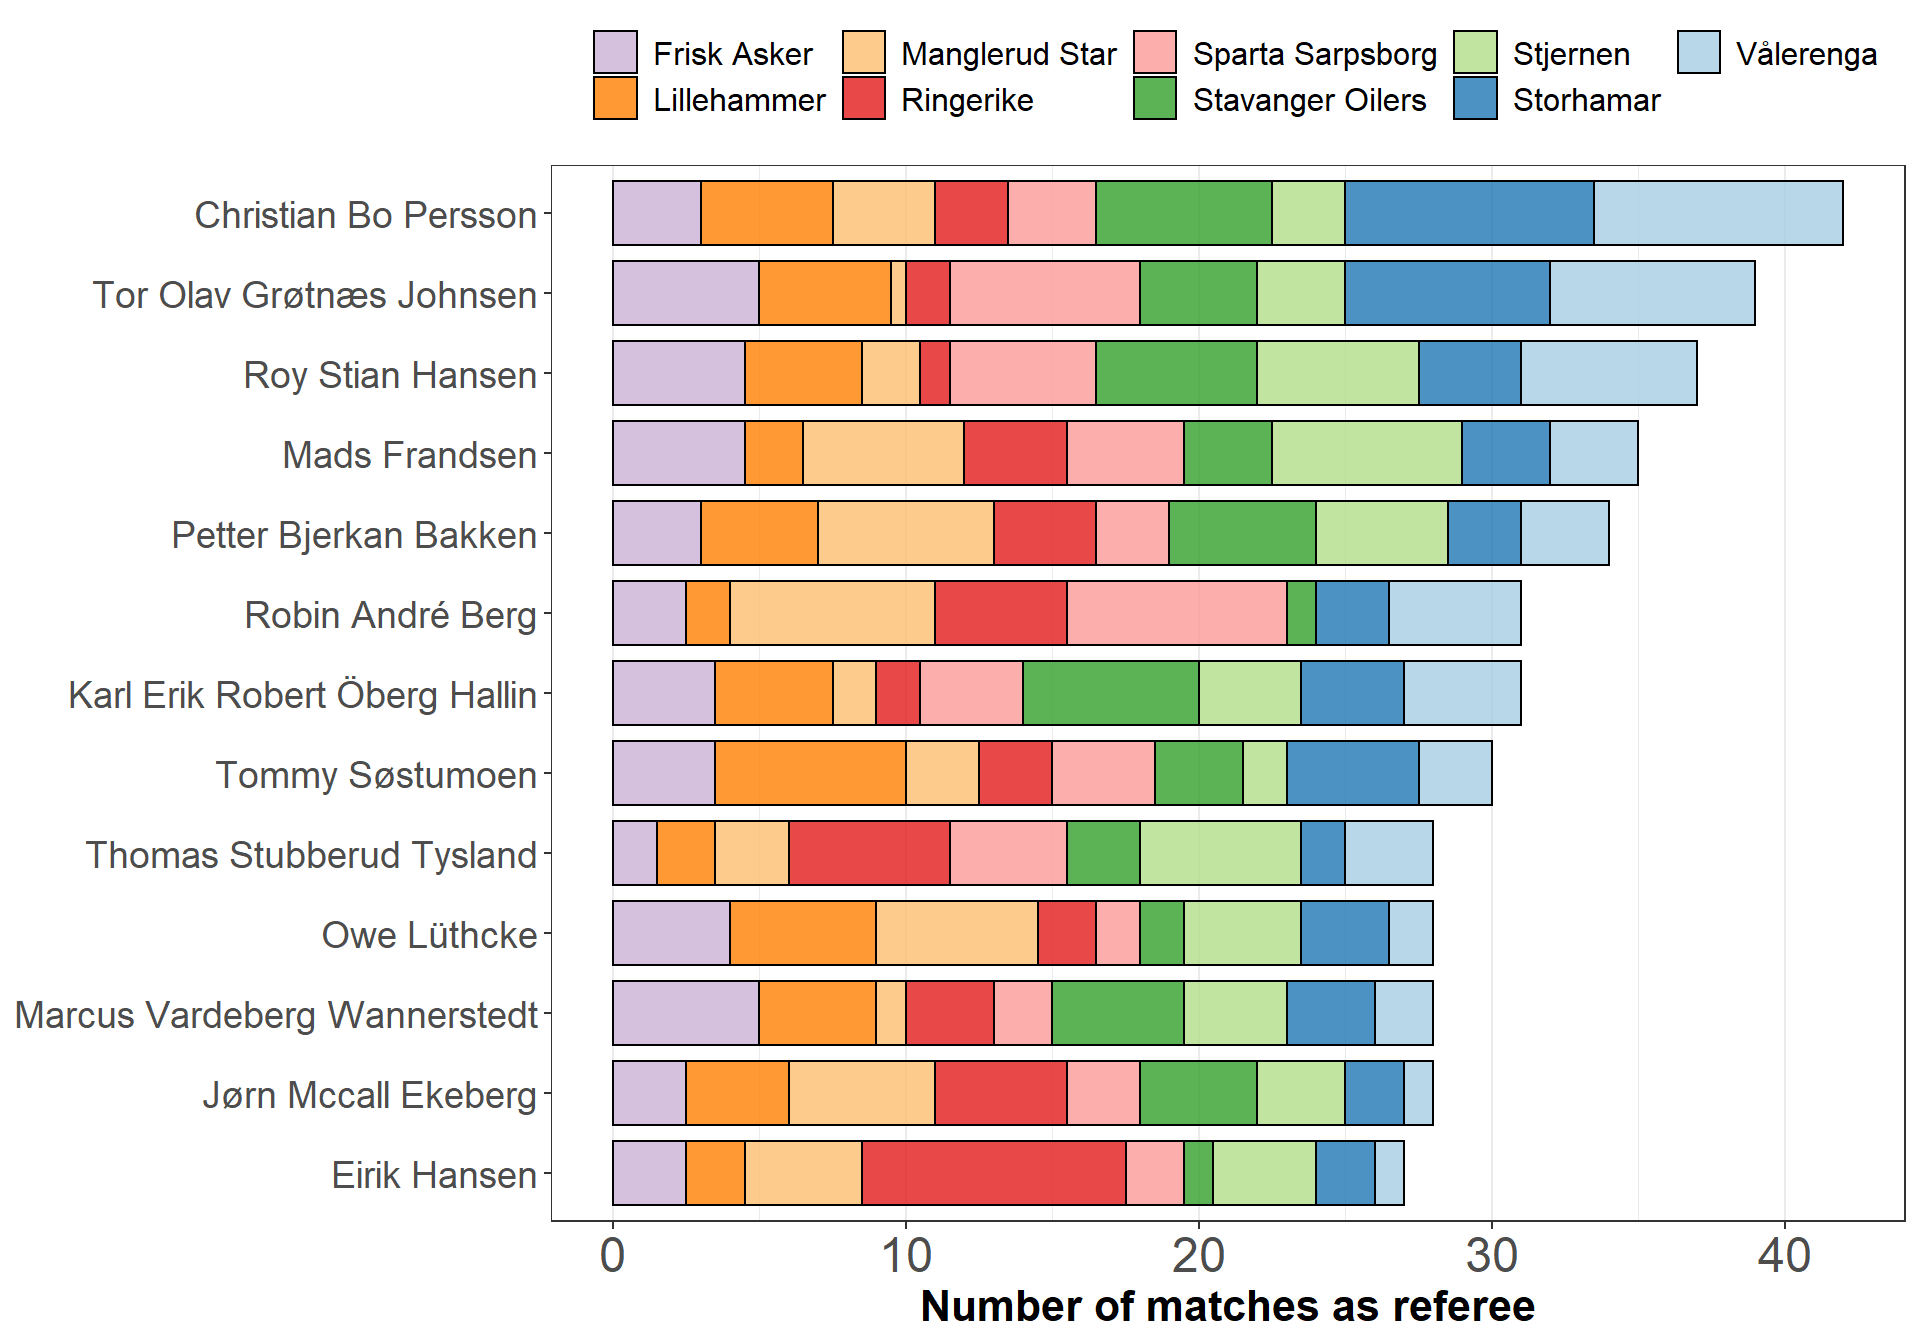
Referees
Are the referees assigned matches at random, or is there perhaps a geographical factor?
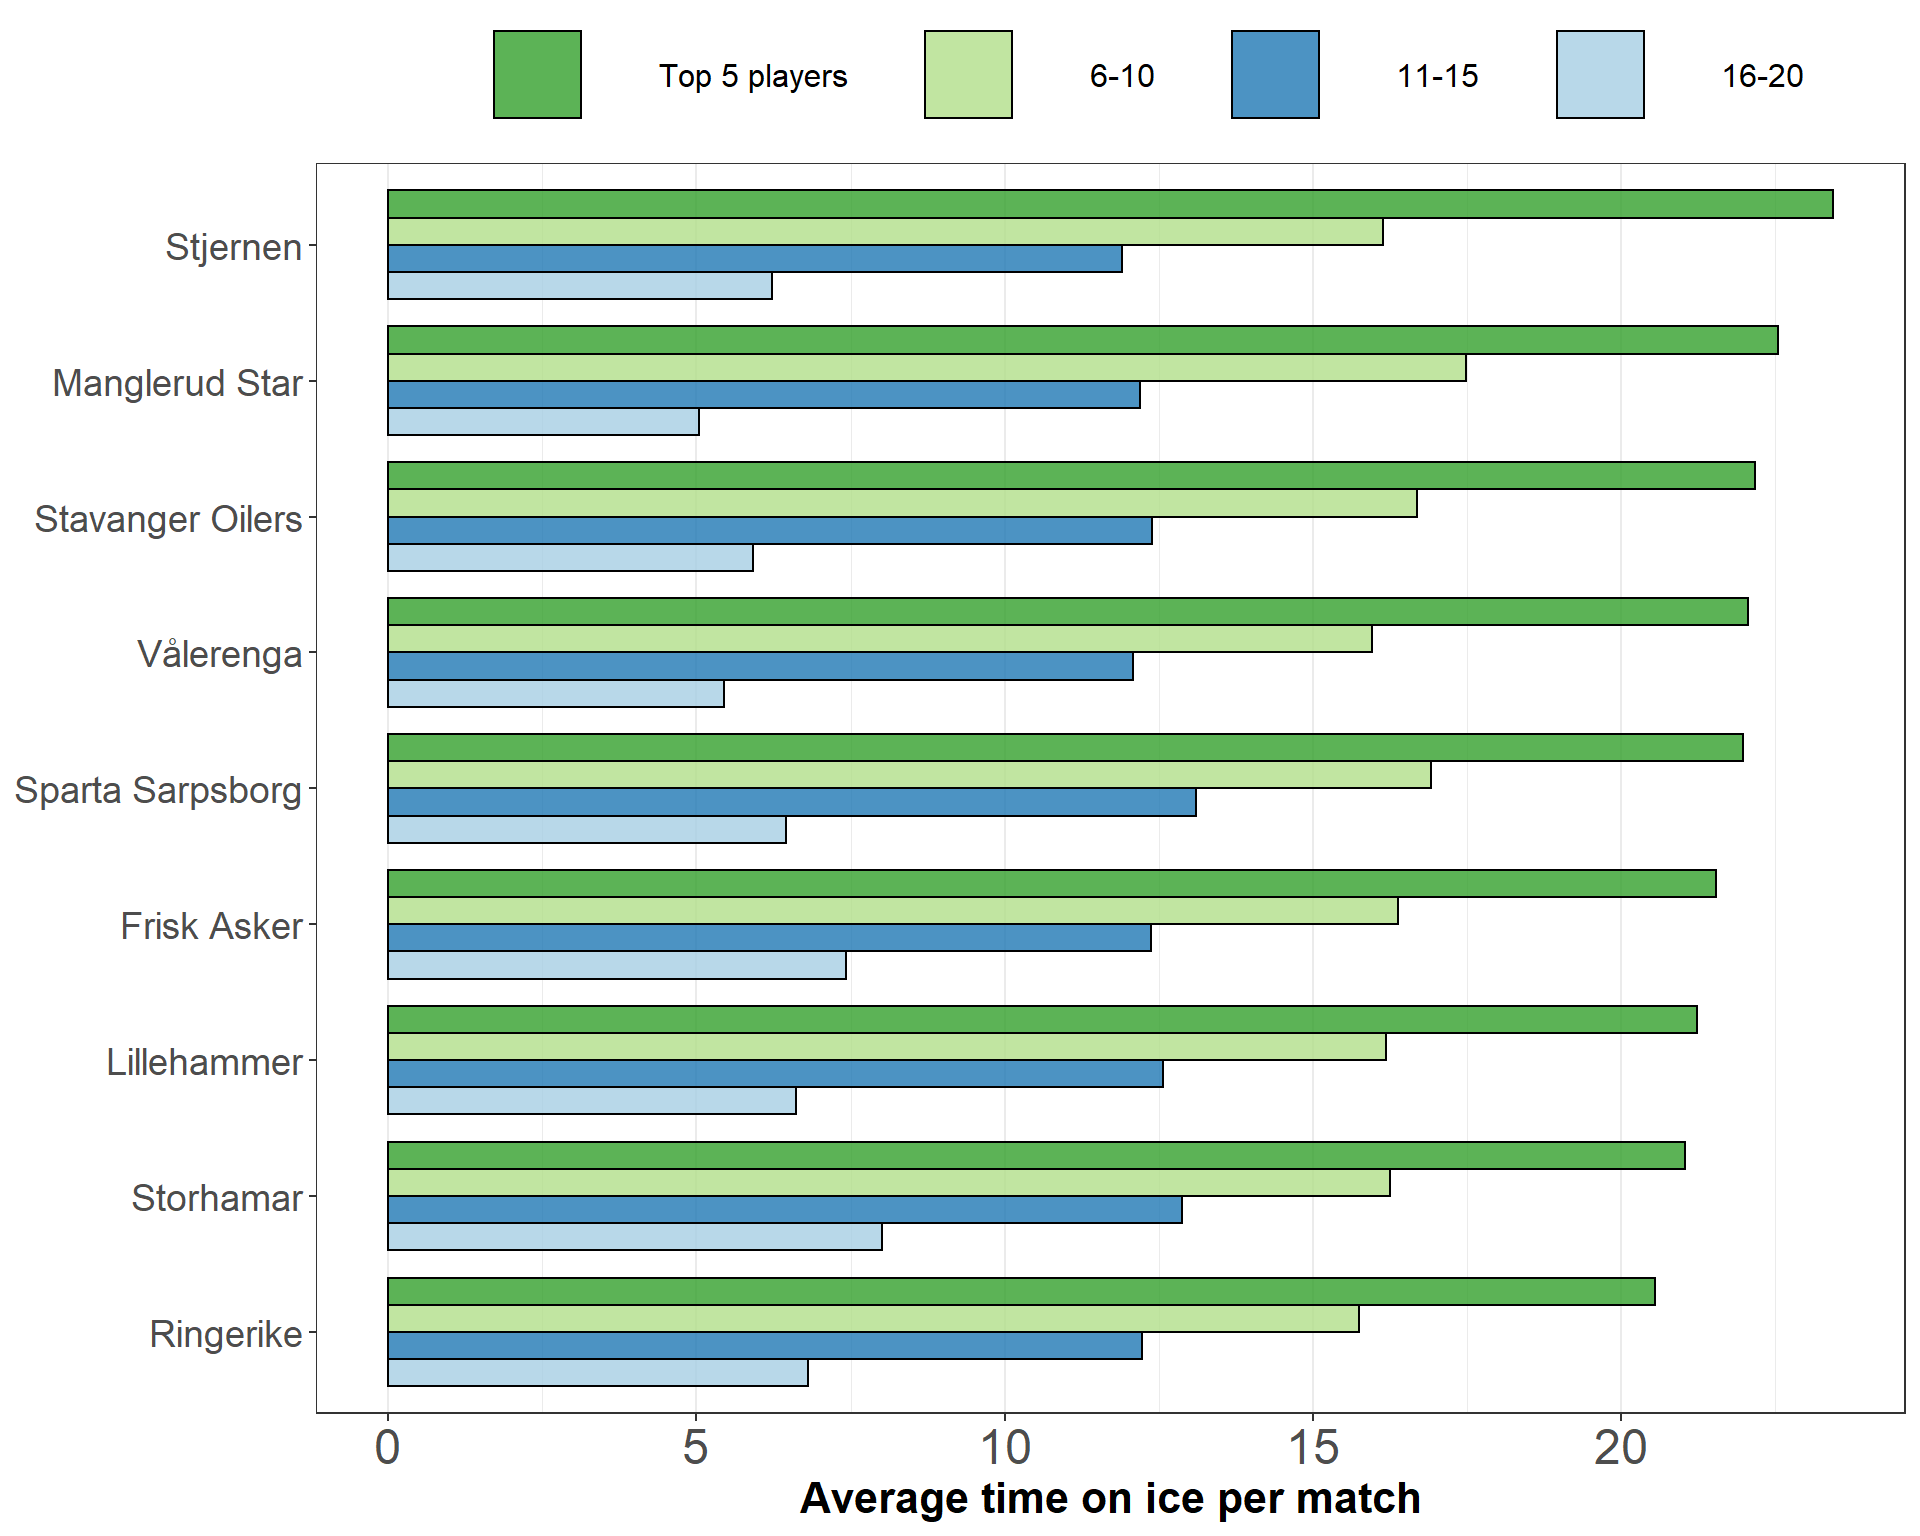
Time on ice?
This last figure shows how hard each team matches their top players, and to what degree they use all 20 players. The “top 5 players” average is the average time on ice for the five players with most time on ice in each game, i.e. not necessarily the same five players in each game.